Statistics - 'It's about making sense of data'
'The best analysis is the simplest analysis which provides the needed insight' (Wheeler)
 STATISTICS is the art of 'explaining variation and learning from data'. It has the power to discover hidden patterns behind seemingly disordered data, to 'seperate signals from noise'. In short, it is about 'making sense of data'.
Specifically with regard to process improvement statistical thinking is a must-have competence to deal with data in a correct way. It supports us in gaining insight, true decision making or in solving (complex) problems. In other words, data is a compass that guides us through a lack of opinions.
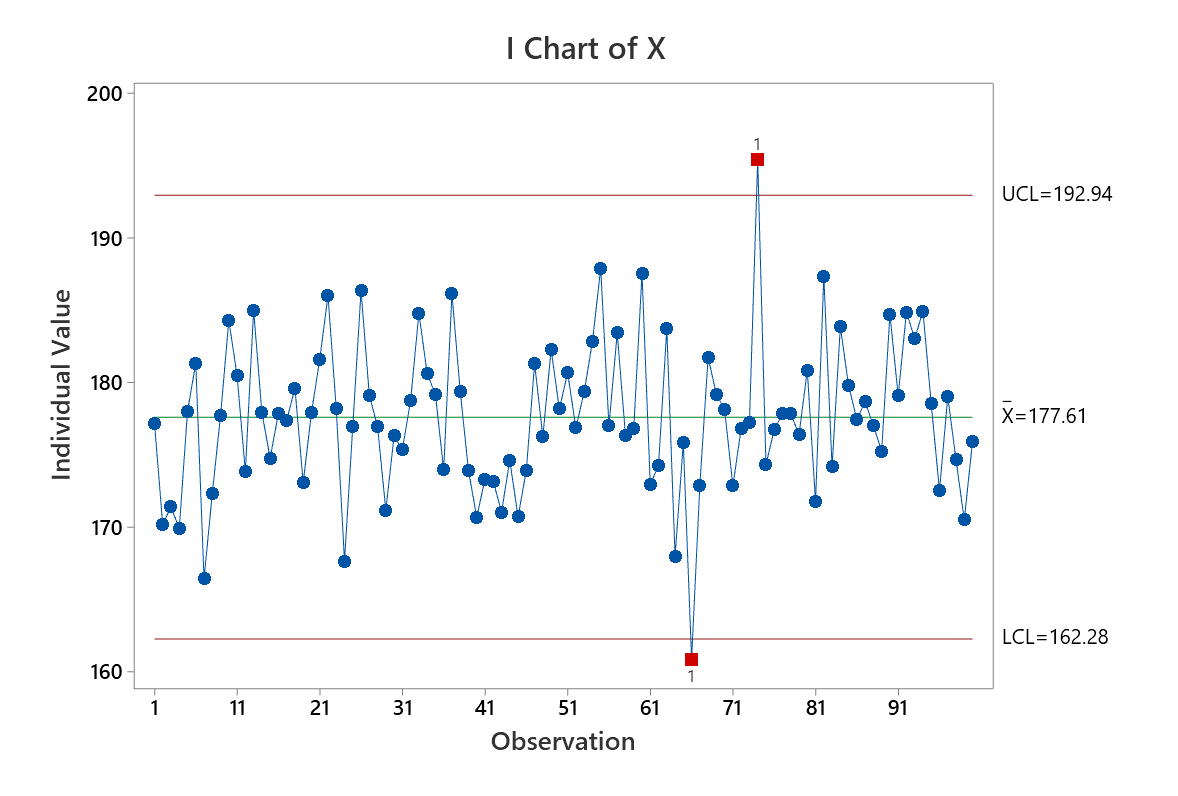
Statistics is applicable in every department and process of an organisation. Take Statistical Process Control (SPC) as an example. SPC is mainly known for its application in production processes, but is equally applicable when monitoring key financial indicators (such as EBIT).
In practice, we often see that the correct data analysis is not always made, and as a result there is a risk for wrong decision making. A few examples : increase of a KPI (while it is not), reaching a target (while it is not the case), seeing an effect (while there is none), confusing a signal or effect with random variation, and so on.
In a nutshell, numbers tell us something, but what exactly do they mean and how can we draw conclusions ? Correct use of data gives us the answer : statistical tools are a powerful tool in answering many practical questions, such as :
- 'Is the output of production line 1 bigger then line 2 ?'
- 'Does the new supplier have a lower defect percentage ?'
- 'Are we on target with our quality performance ?'
- 'Has our improvement project the expected effect on the scrap level ?'
- 'Does lab A perform better than lab B?'
- 'Is our process stable and in control ?'
- 'Is EBITDA really increasing, or are we looking at random variation ?'
- 'Is there a real decrease in the number of complaints ?'
- ...
How can we help ?
- Making sense of data - learn how to 'convert data into information'
- Coaching - supporting improvement projects with structure and analysis
- Training - learning statistics for process and quality improvement
- Minitab - introduction in Minitab (software for statistical analysis and visualisation)
- ...